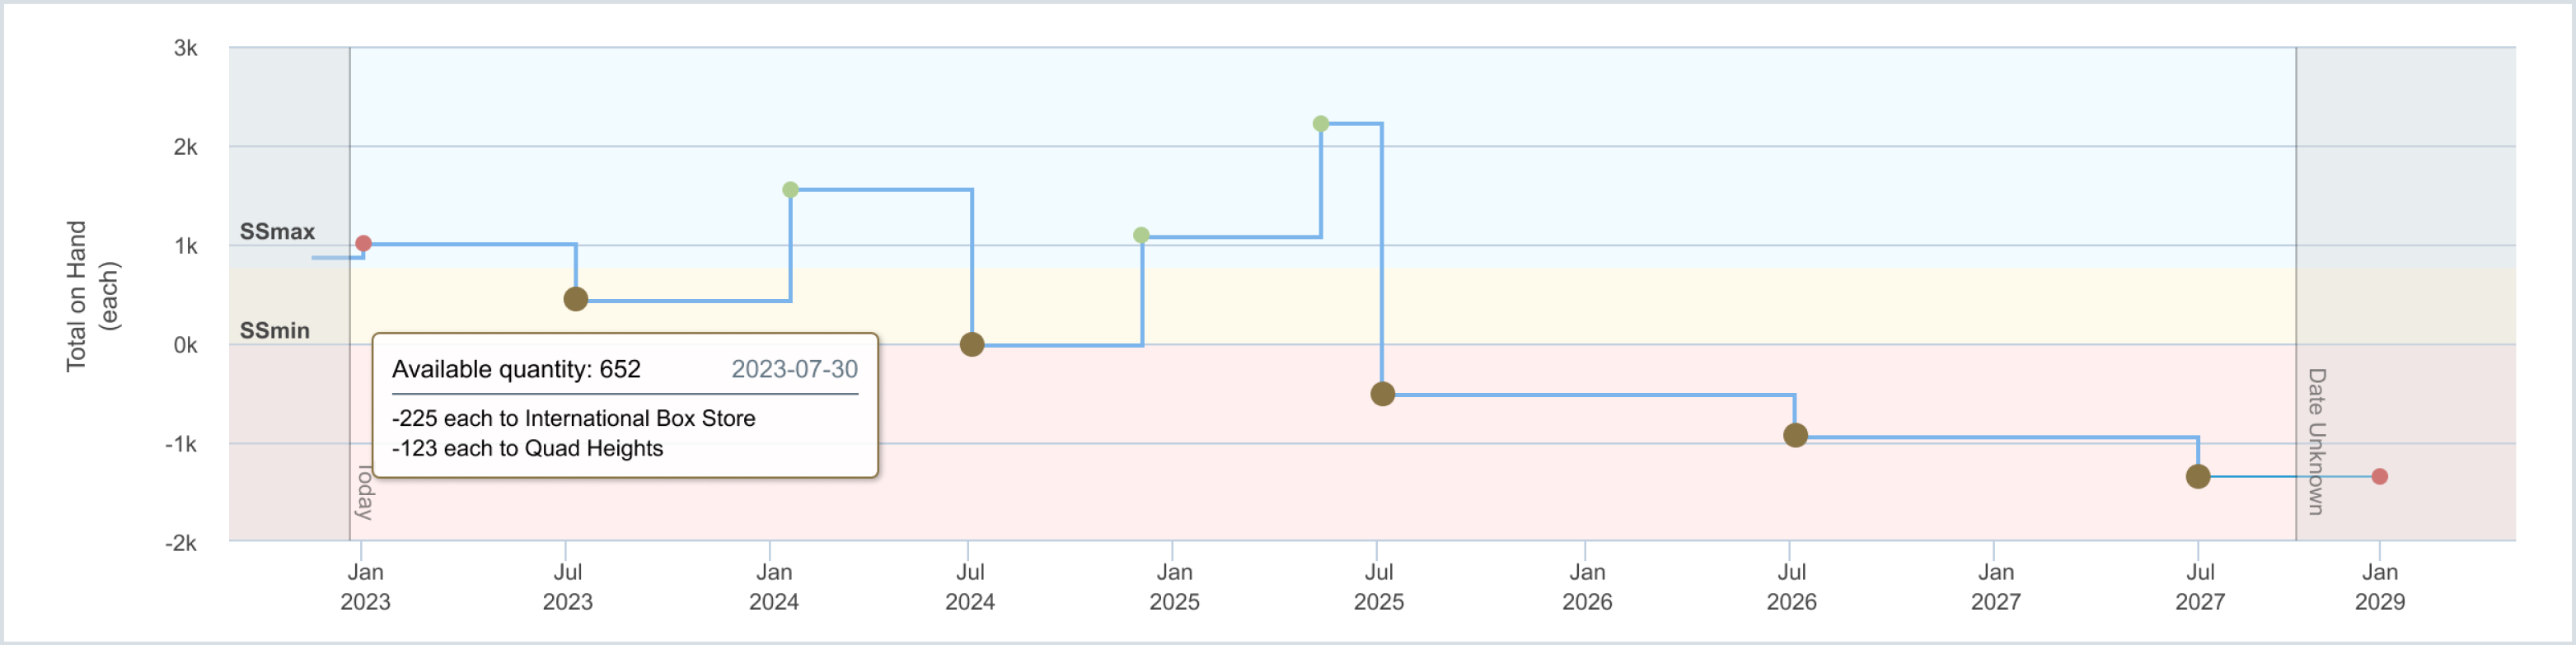
The inventory forecast chart depicts expected changes in inventory over a period into the future based on the current data available in Aligni. It offers the following features:
- A unified visual of incoming and outgoing inventory plotted as events on a time axis
- A backdrop representation of safety stock presets
- A mouse-over legend to quickly view referenced inventory events
The chart is updated in real time so any changes to inventory, builds, or promise dates are reflected immediately without any need for nightly processing or batched updates.
Overview
The forecast chart shows the predicted inventory levels over time, based on several factors.
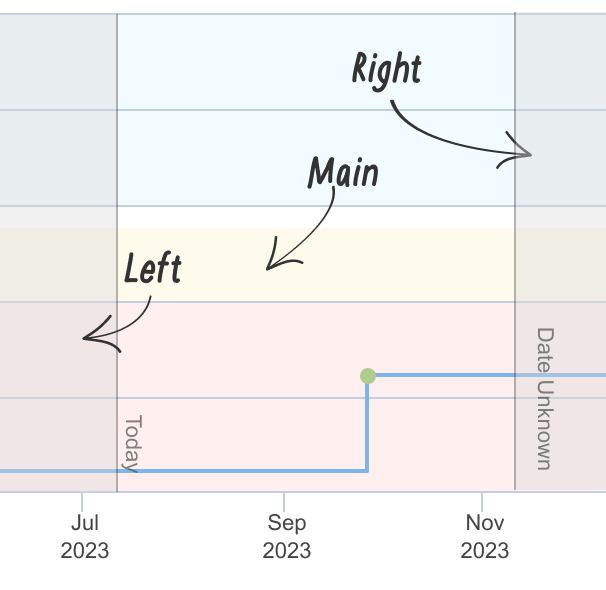
The time period has three sections:
- Main section – shows an 18 month projection starting from the current day.
- Past Zone – shows all level changes within the past 30 days.
- Infinity Zone – events that do not have a clear specified date, such as unspecified promise dates, are placed to the right past the valid period of the chart.
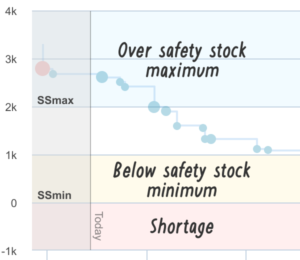
Safety Stock Bands
The chart is color-banded to illustrate where the inventory level falls within specified safety stock levels, if specified for the item:
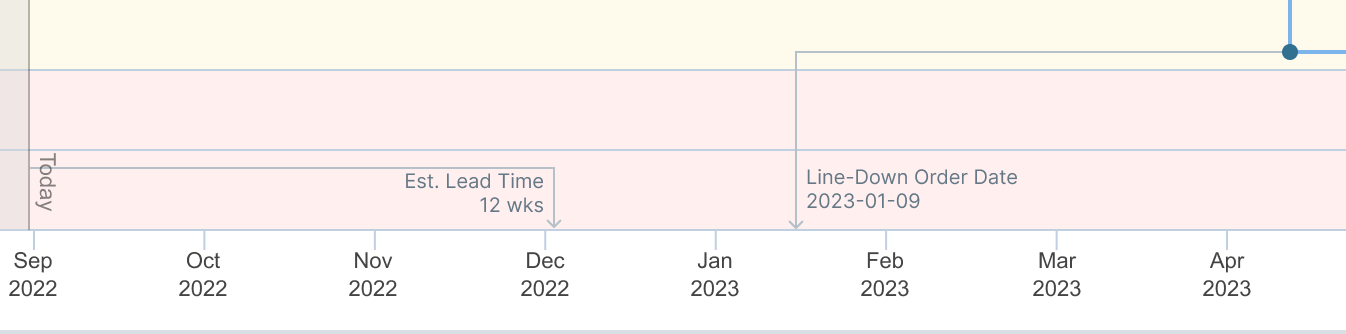
Standard Lead Time
For items with an established standard lead time, the lead time is depicted in two ways. First, the lead time for an order placed today is shown extending from the left side of the chart. Second, if the item goes below safety stock minimum within the range of the chart, the order-by date is depicted extending left from the point where this occurs.
Influence Factors
Detailed below are the factors that influence the graph data nodes:
- Each influence factor is illustrated by a specific color.
- Each data node on the graph has a direct relationship to the quantity reflected in the factor.
When the data node is selected, a tooltip appears with additional details.
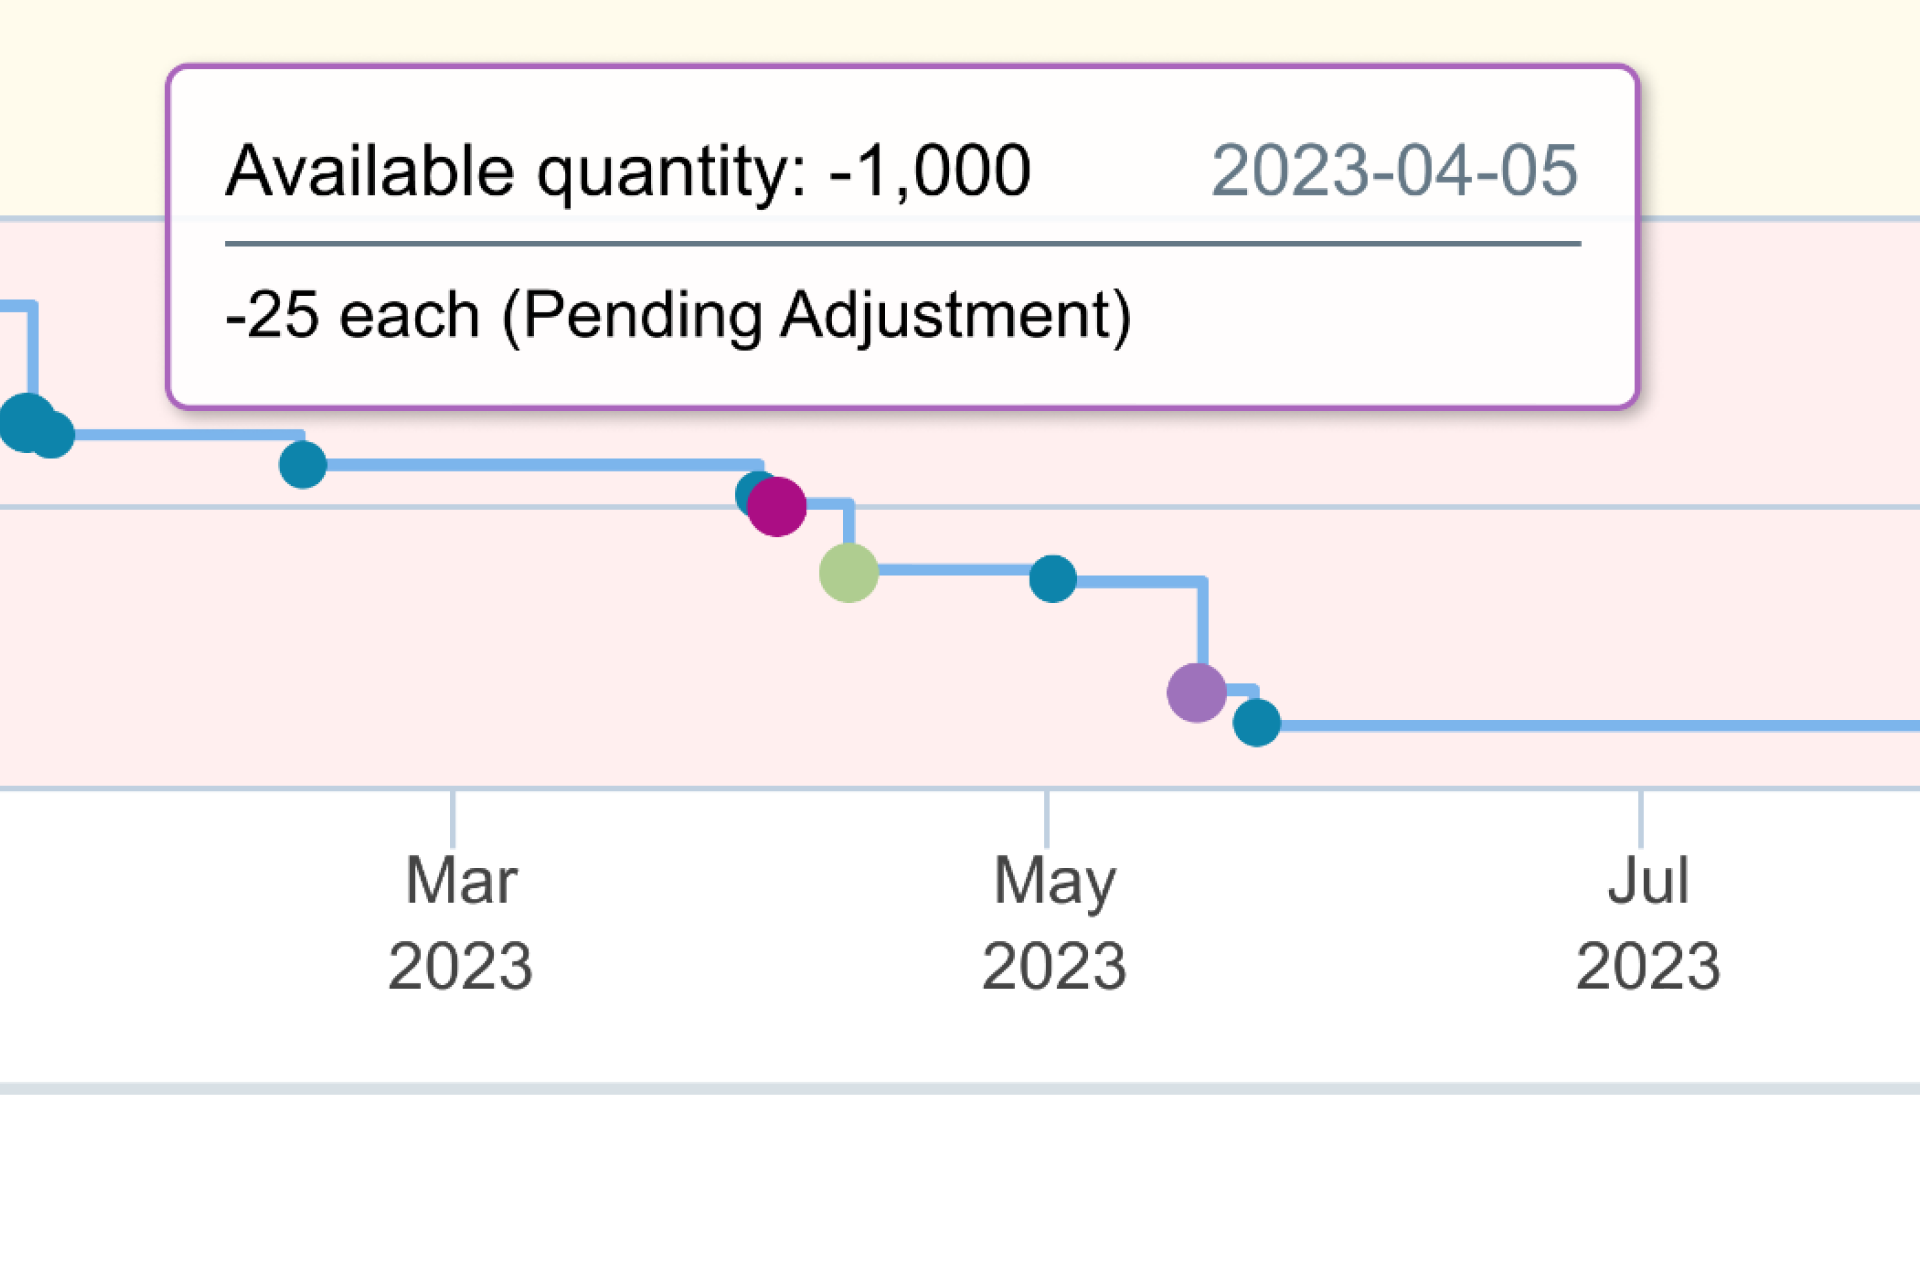
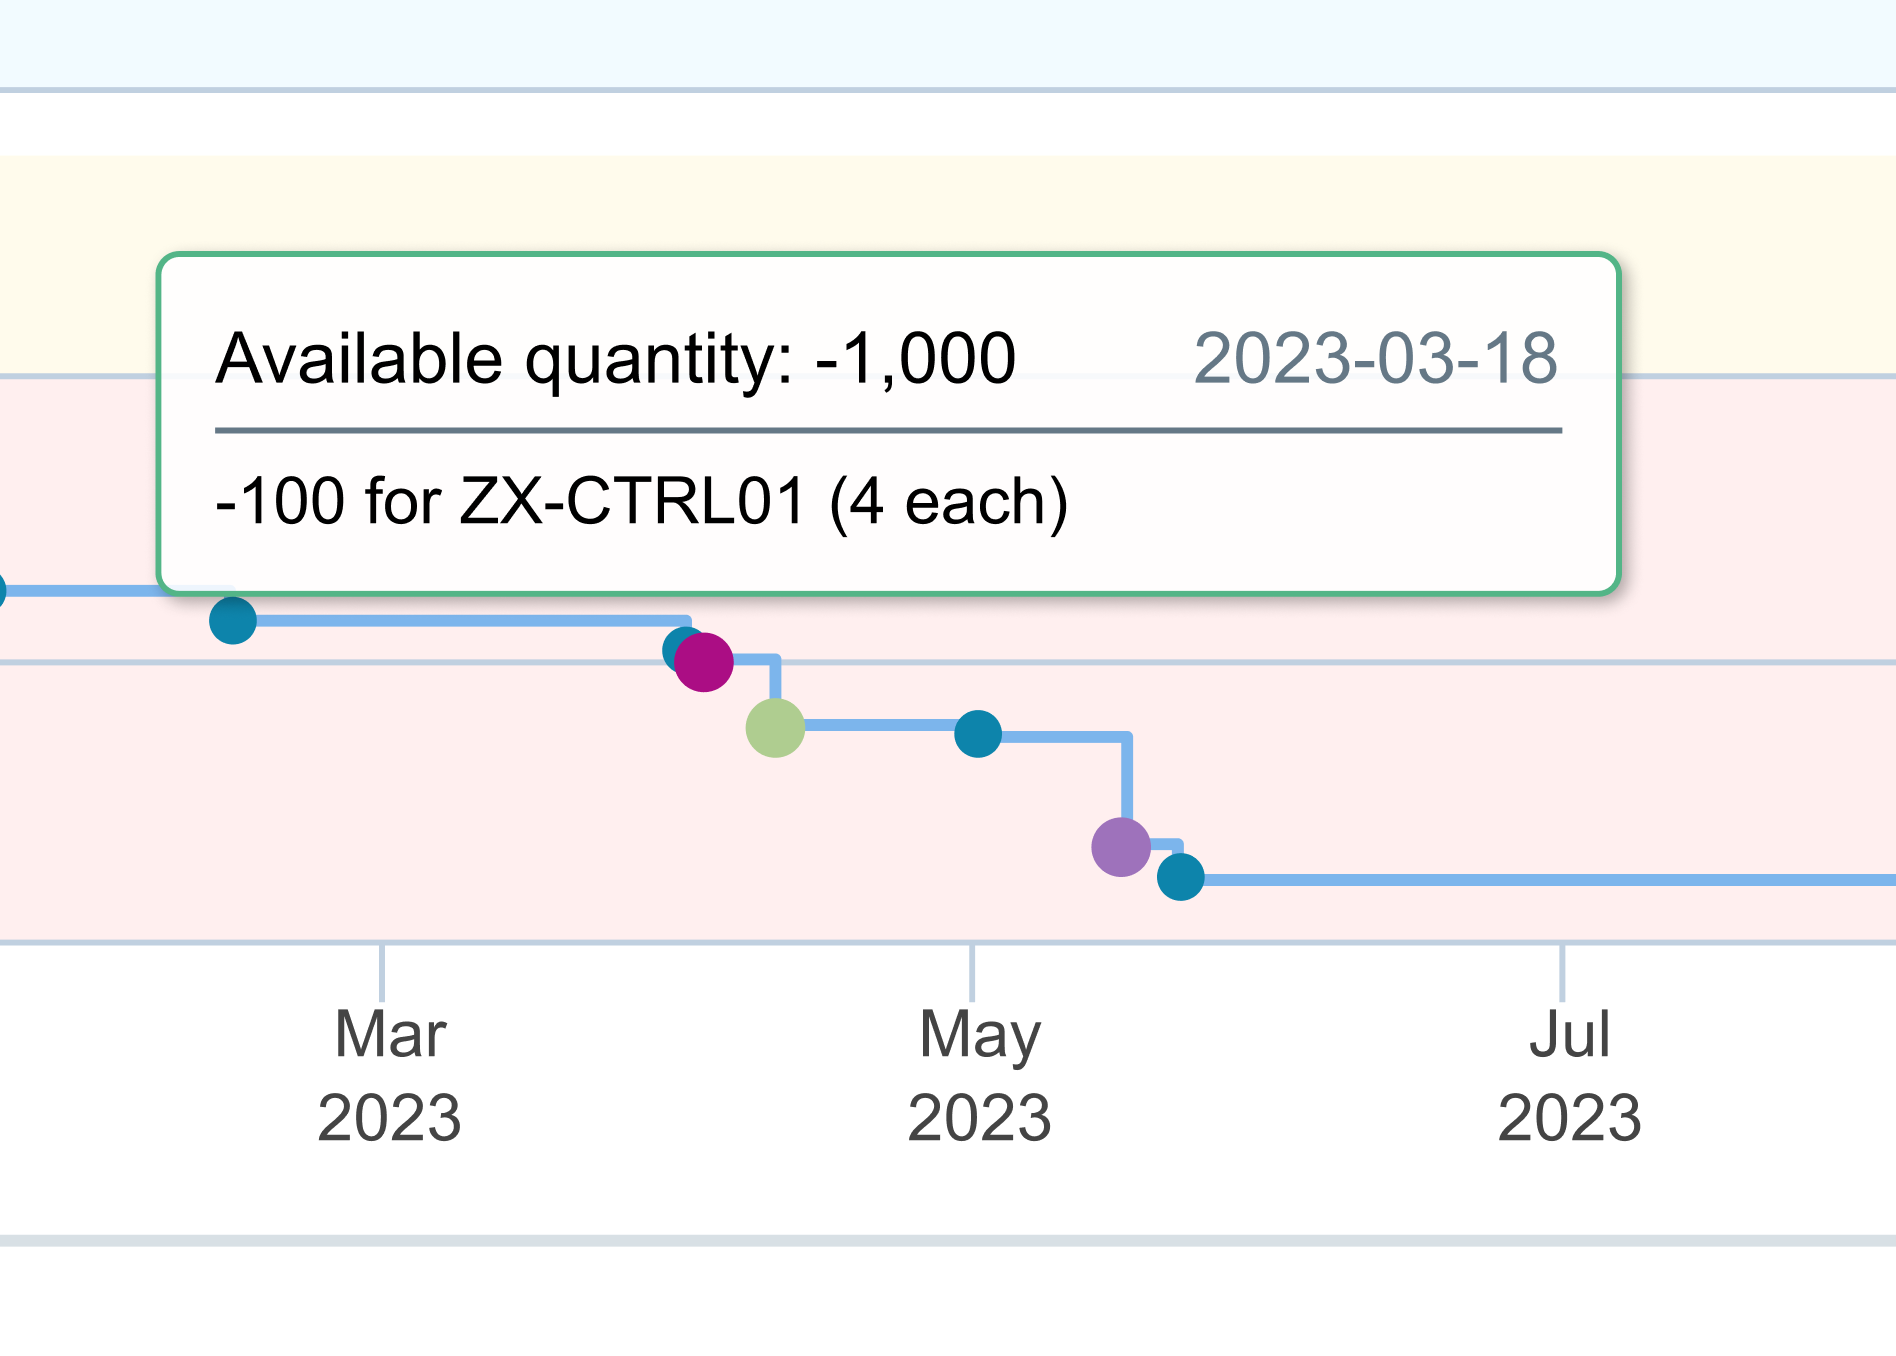
Inventory Adjustment
Bulk inventory adjustments are often performed on part collections rather than a single part, typically due to activities such as cycle counts. Bulk adjustments are indicated as pending until the adjustment is finalized. Note that only negative adjustments are shown in the chart because they do not represent “predictable” ingress, as purchase does. Pending inventory adjustments are represented with the following data node and dialog.
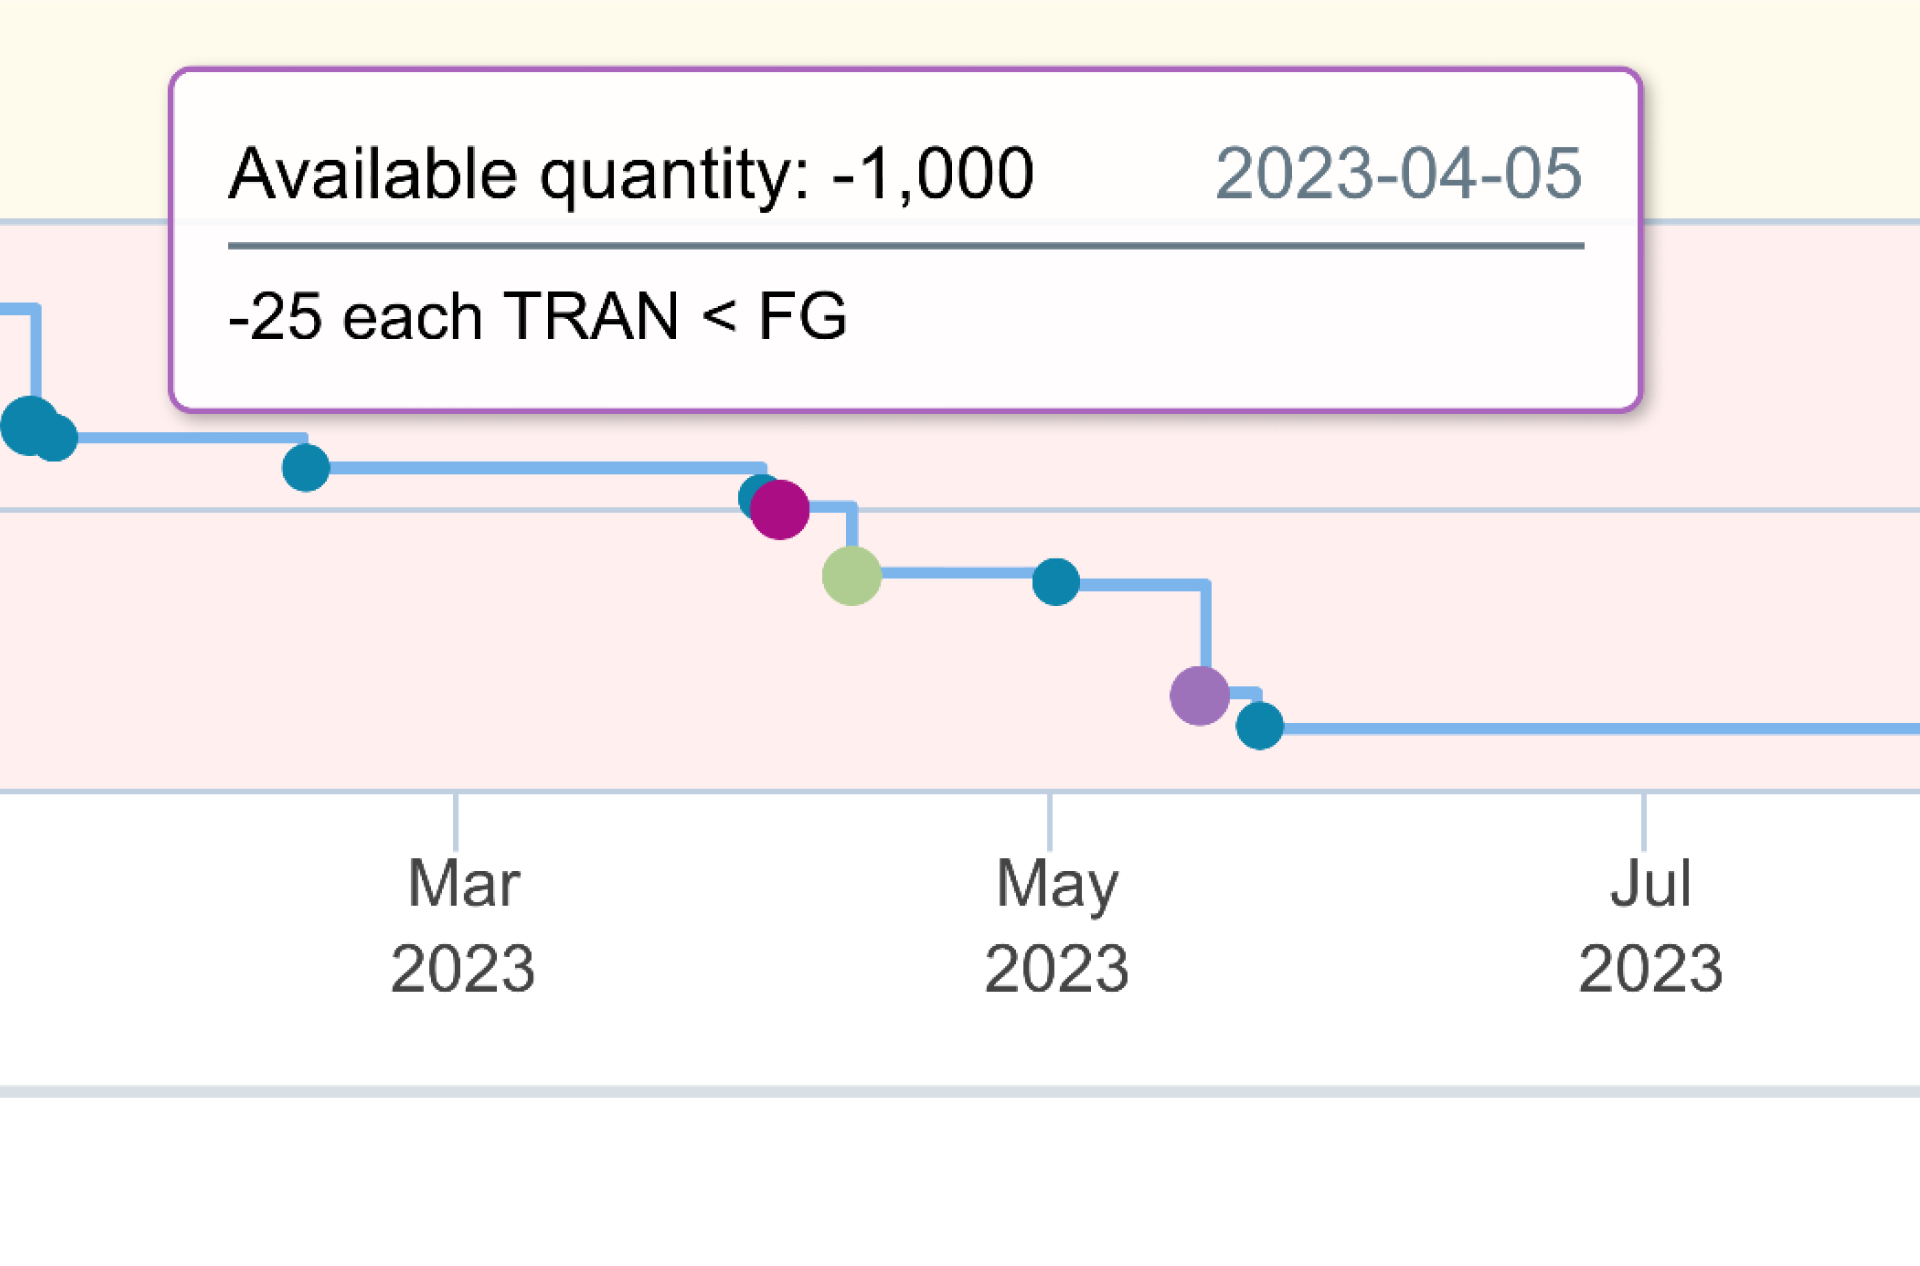
Inventory Transfer
Inventory Transfer between locations represent the impacts for future levels within the associated locations. Depending if the inventory location selected is receiving or allocating the inventory this will be a positive or negative level change.
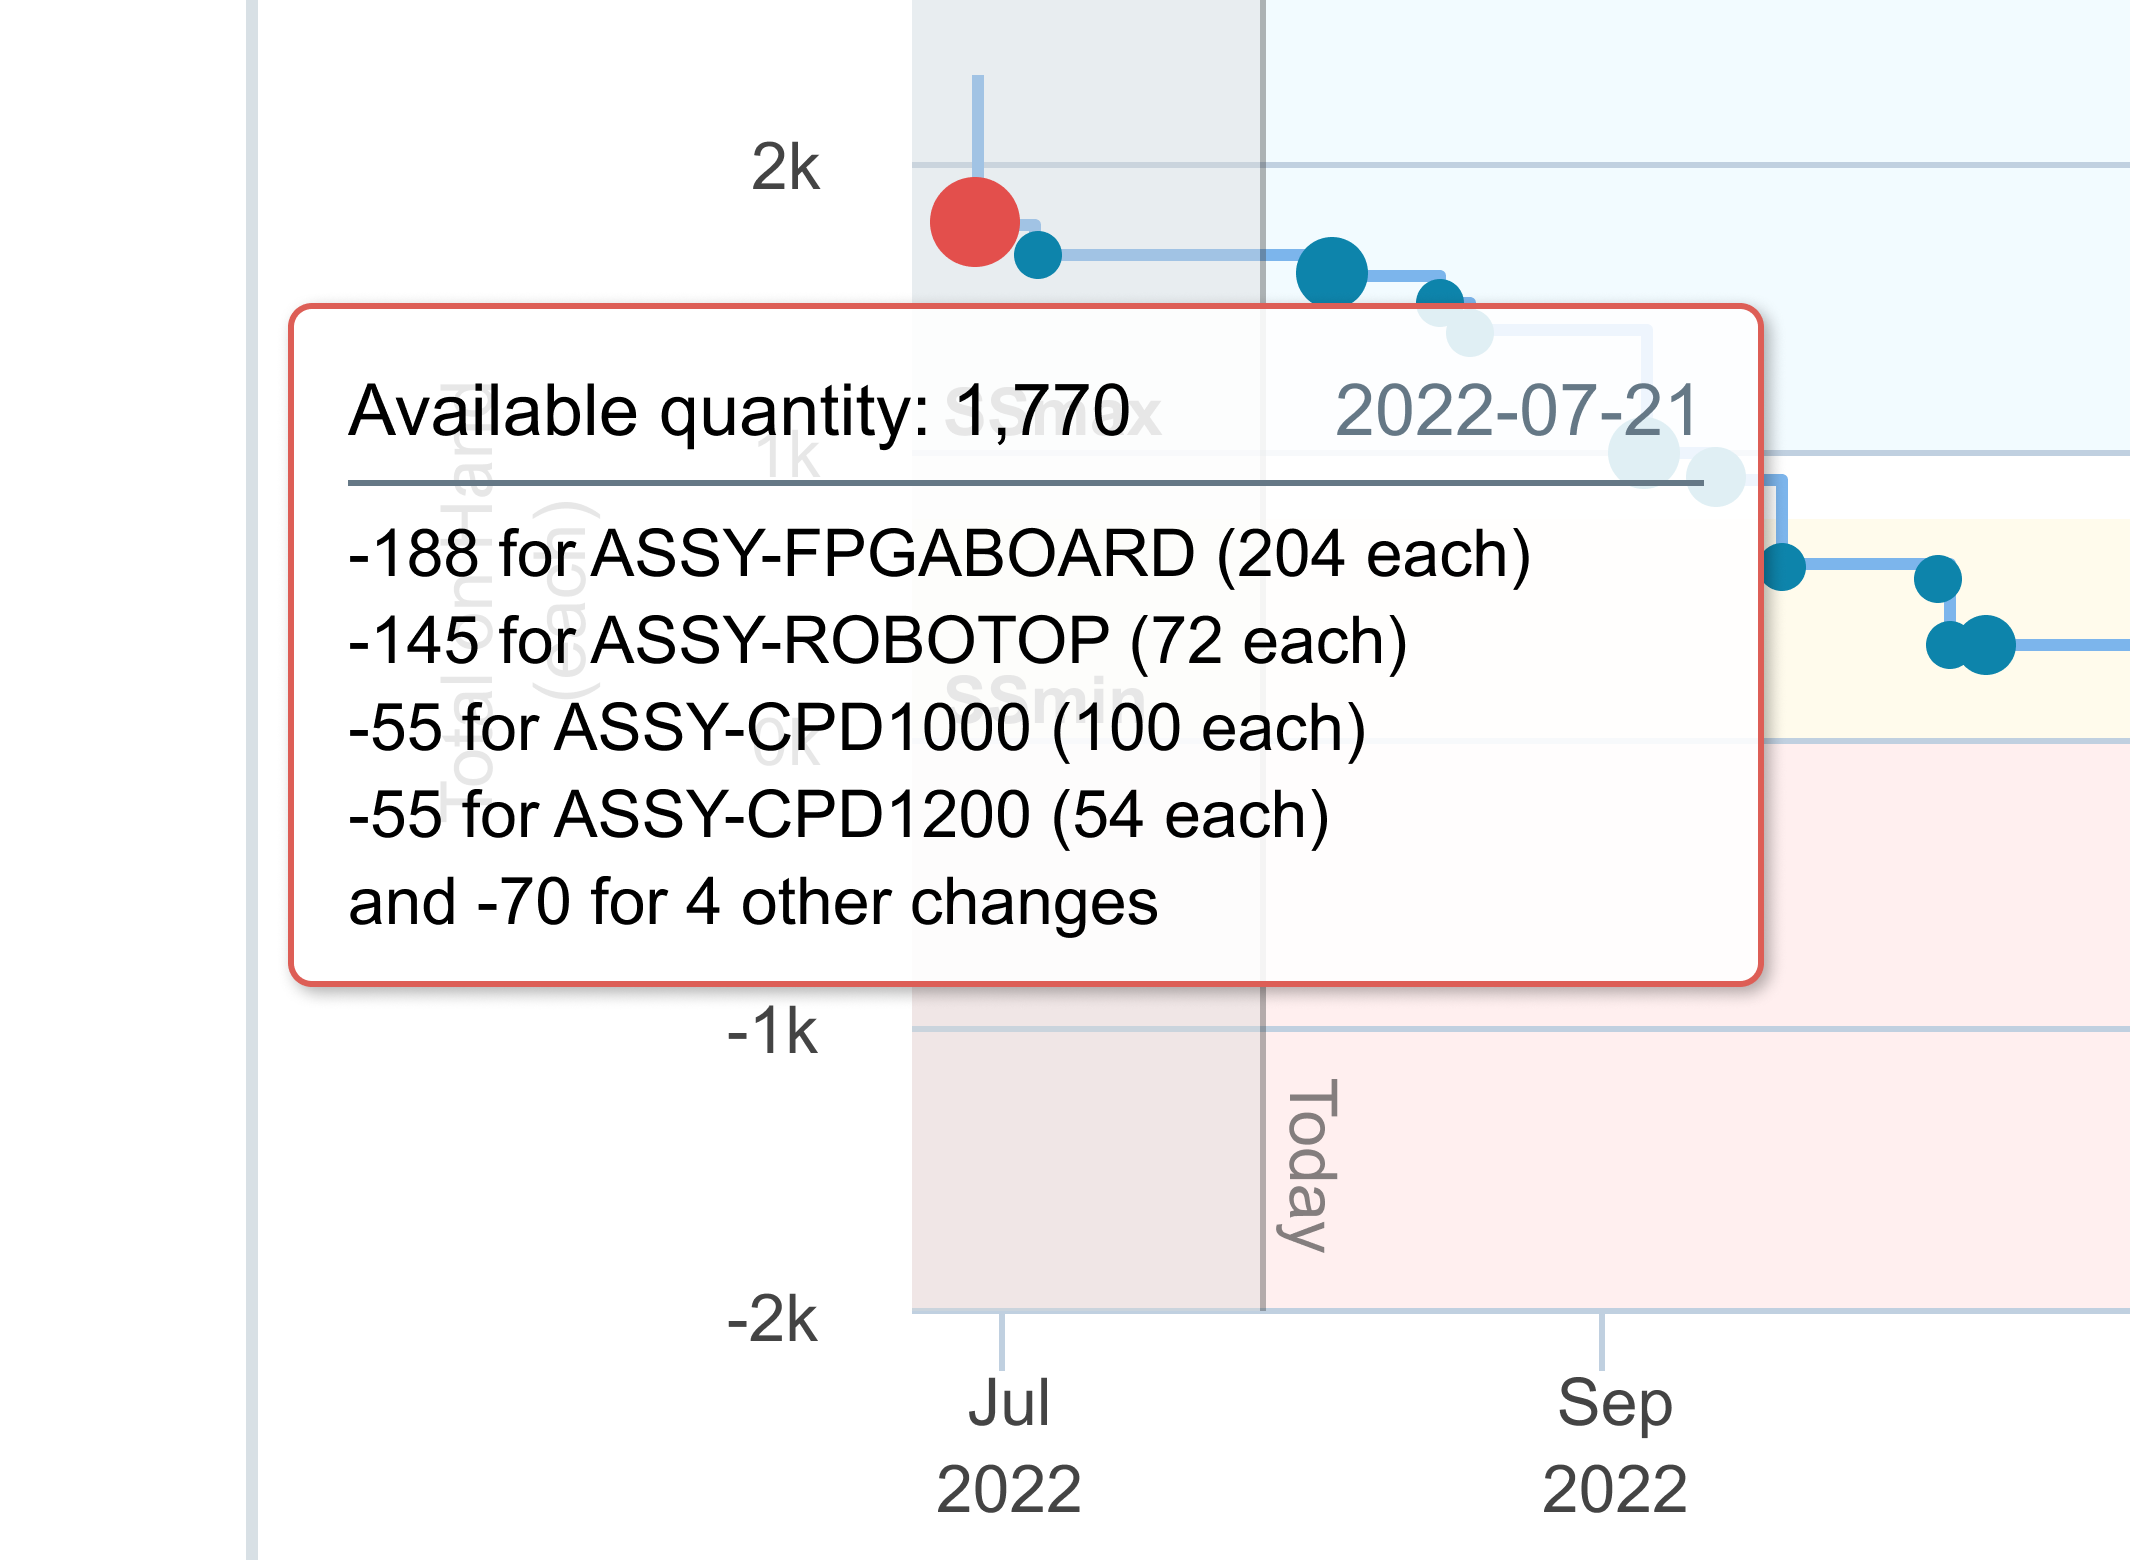
Build Allocation
Inventory reductions for an allocated build are placed at the Expected Reserve date of build, even if this date is in the past.
Build Reservation
Build reservations reduce available inventory. The inventory forecast chart depicts this as a reduction in inventory at the earliest date on the chart.
Build Finalization
Build finalization produces inventory of a completed assembly. The inventory forecast chart depicts an increase in inventory located at the expected completion date of the build. Note that planned and recurring builds are not indicated on the chart.
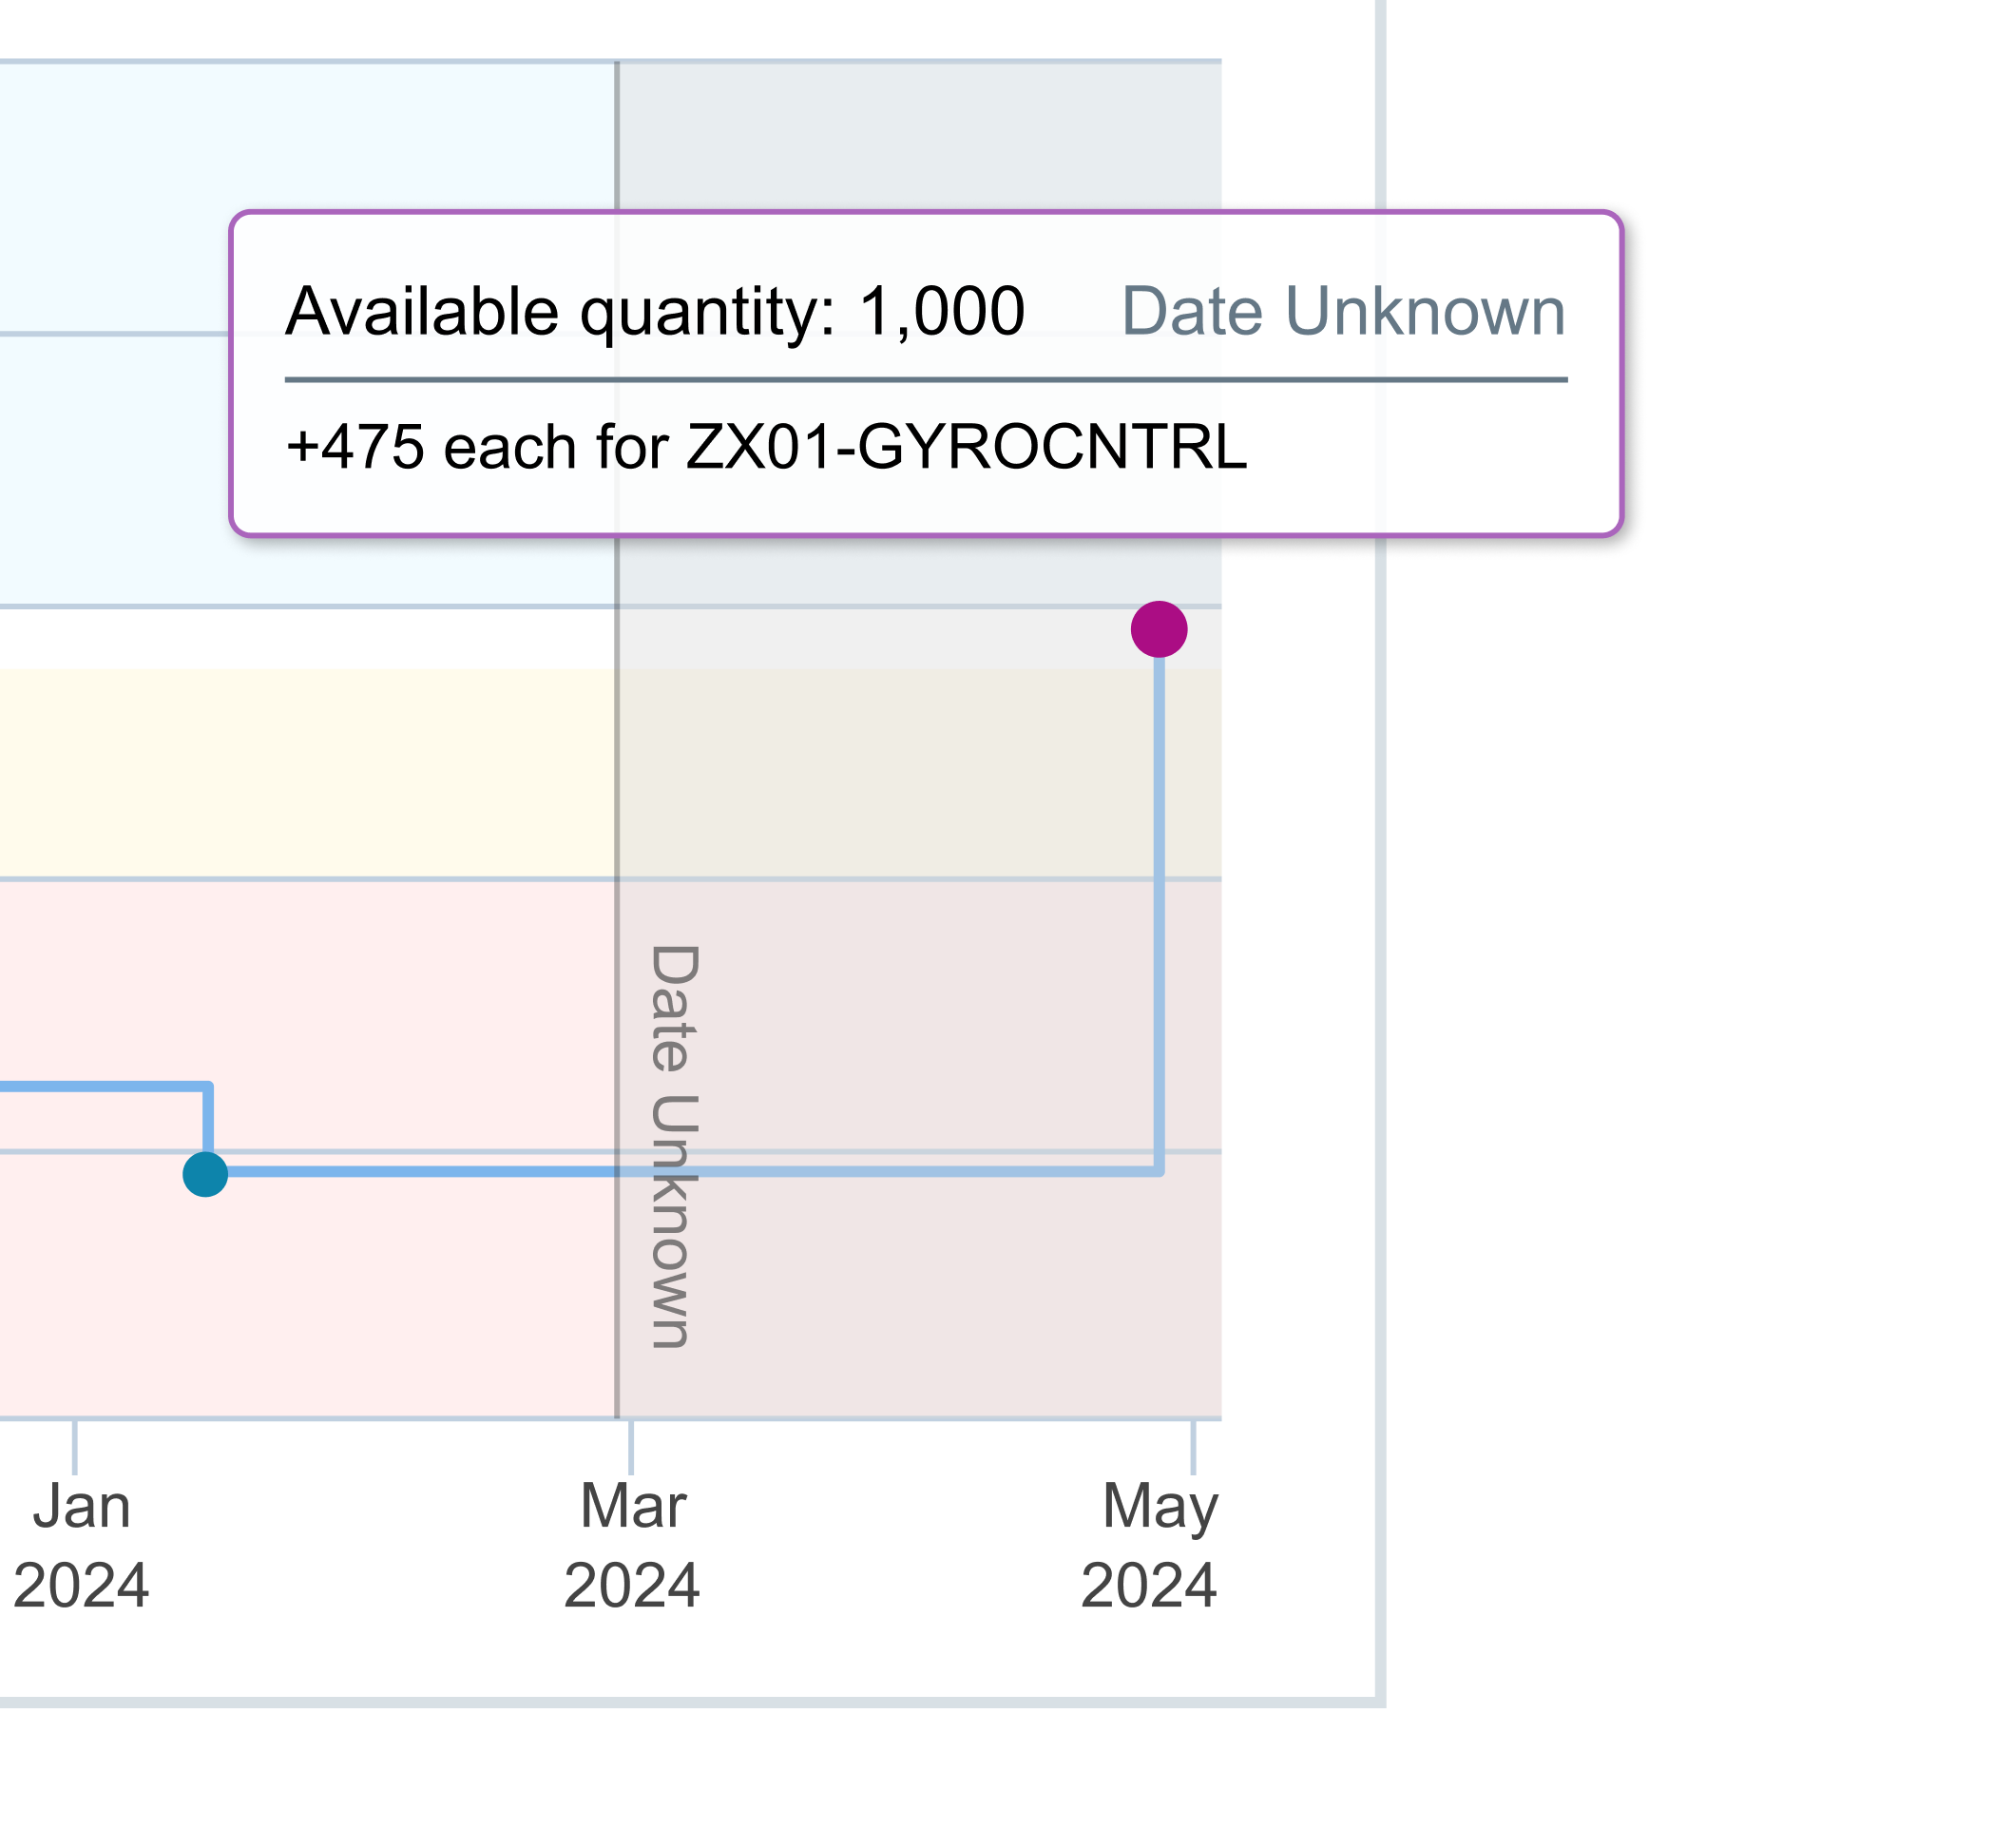
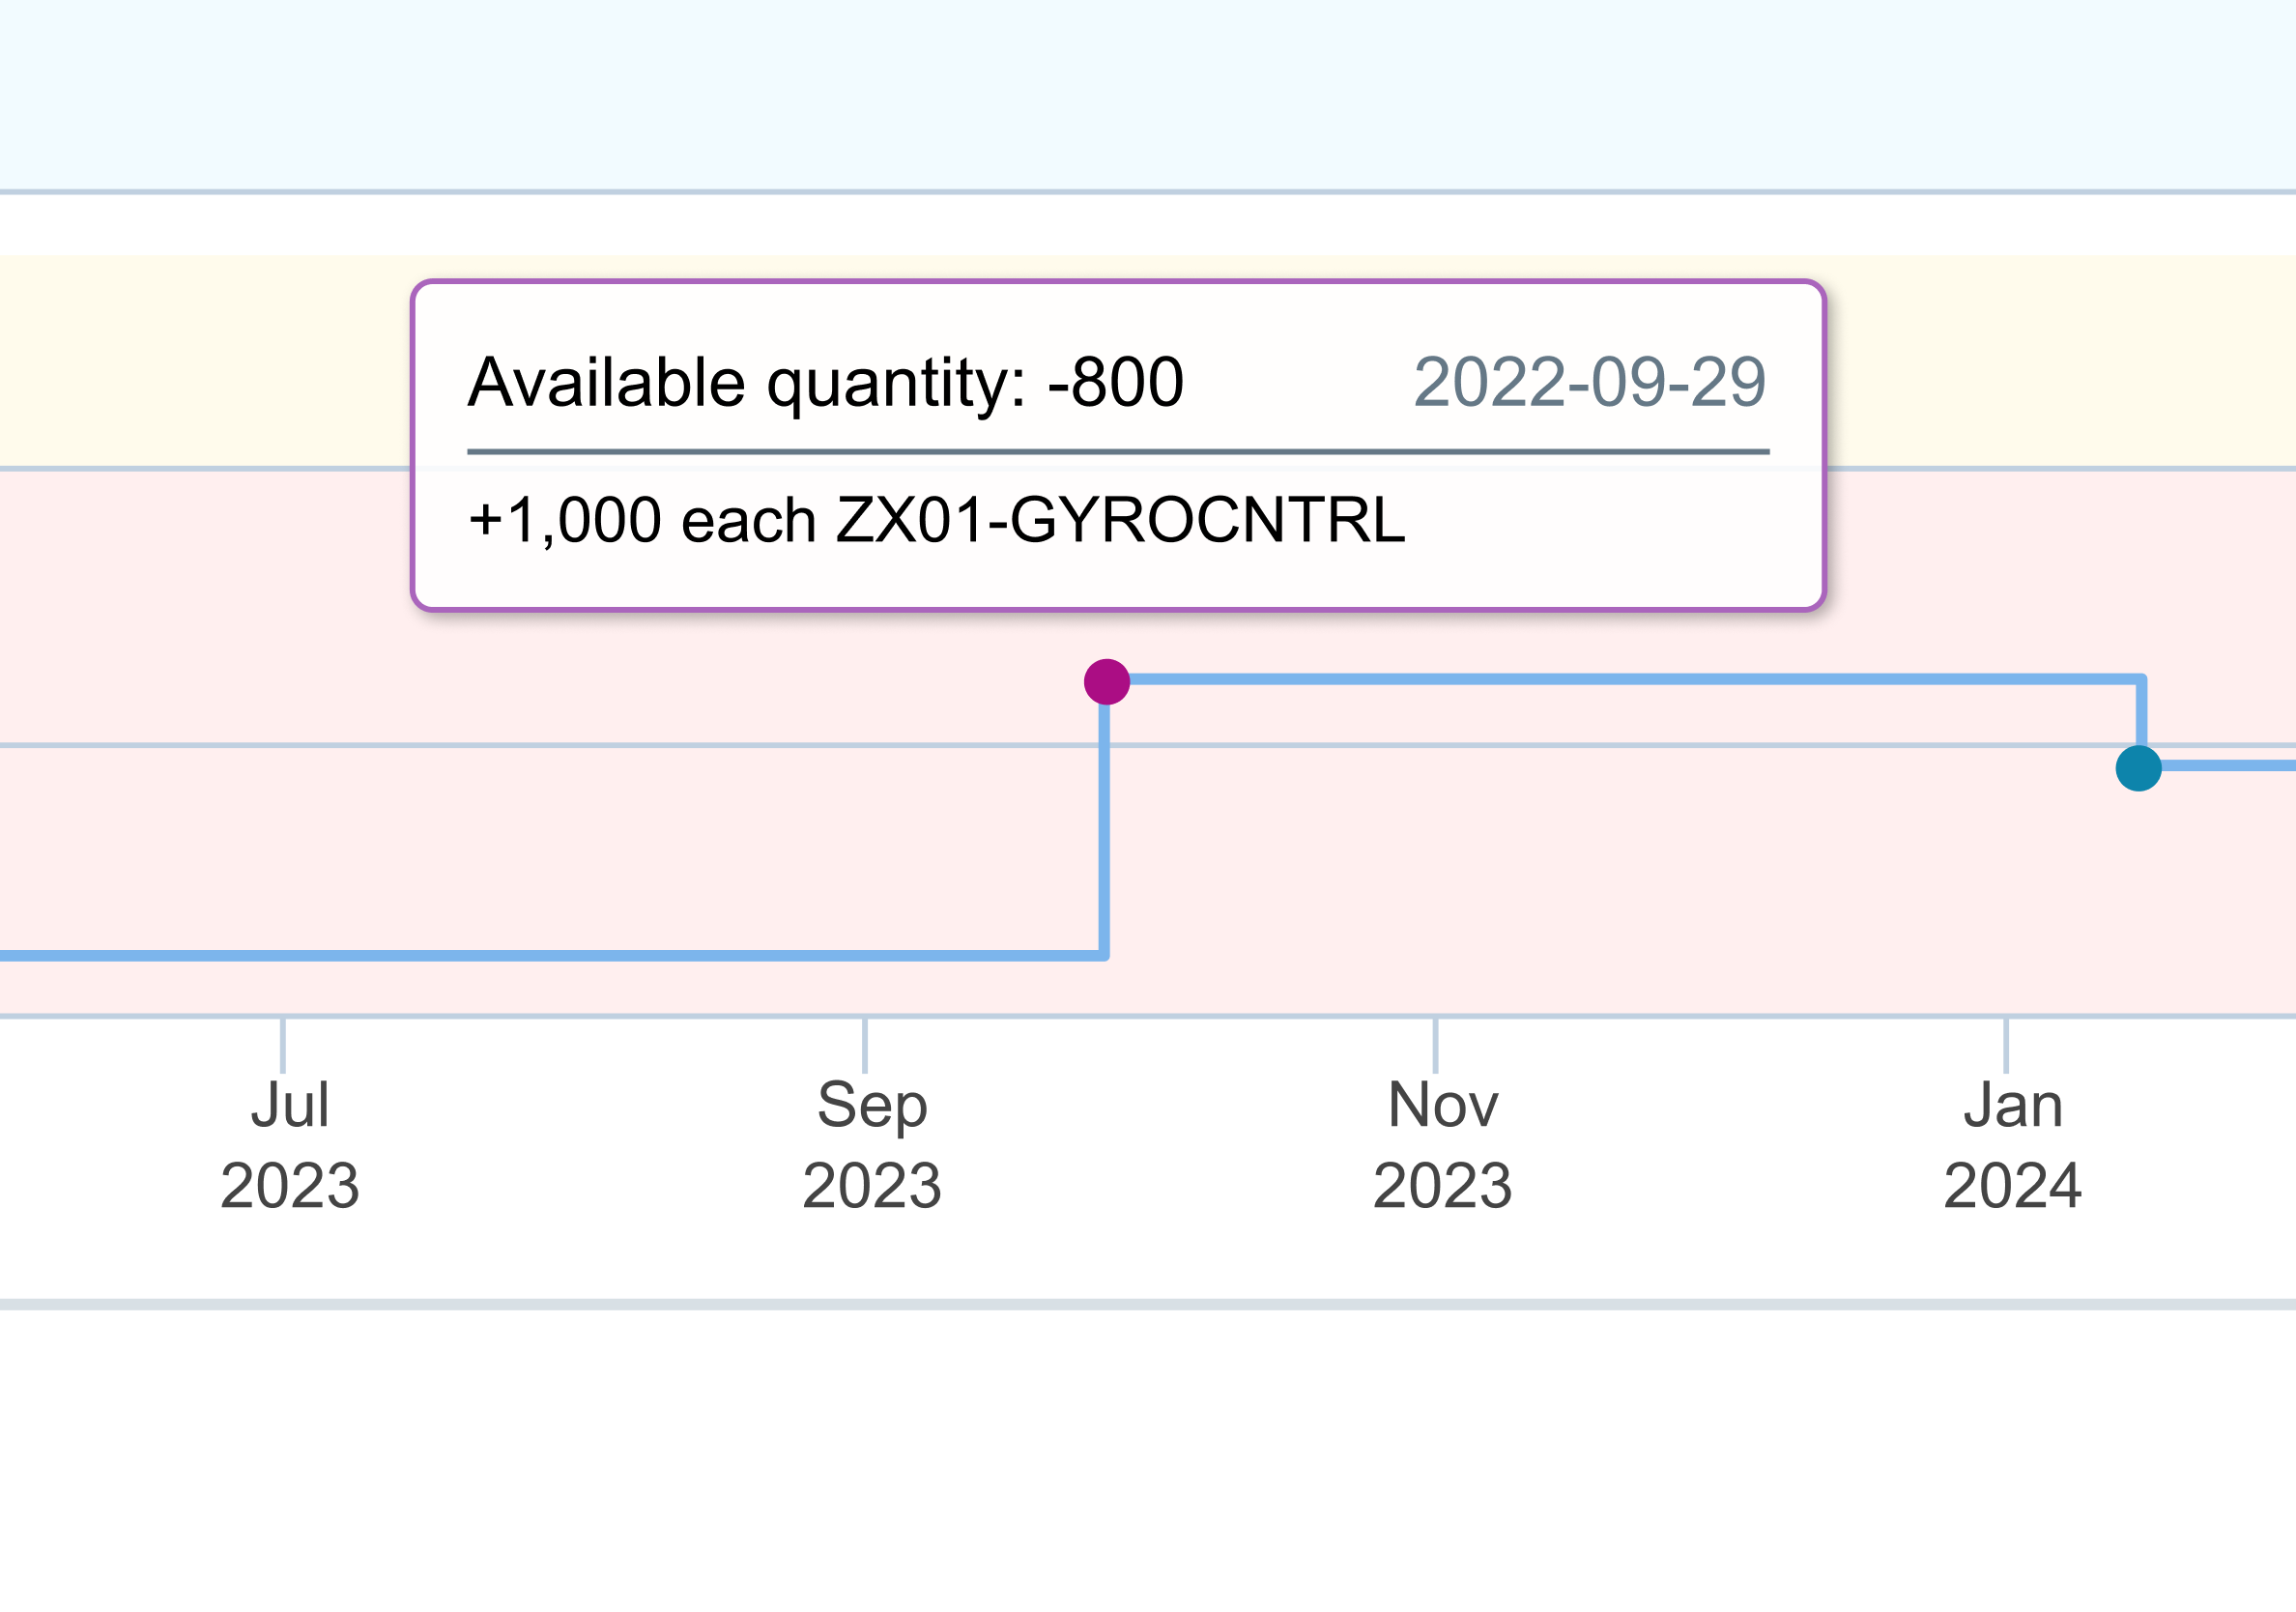
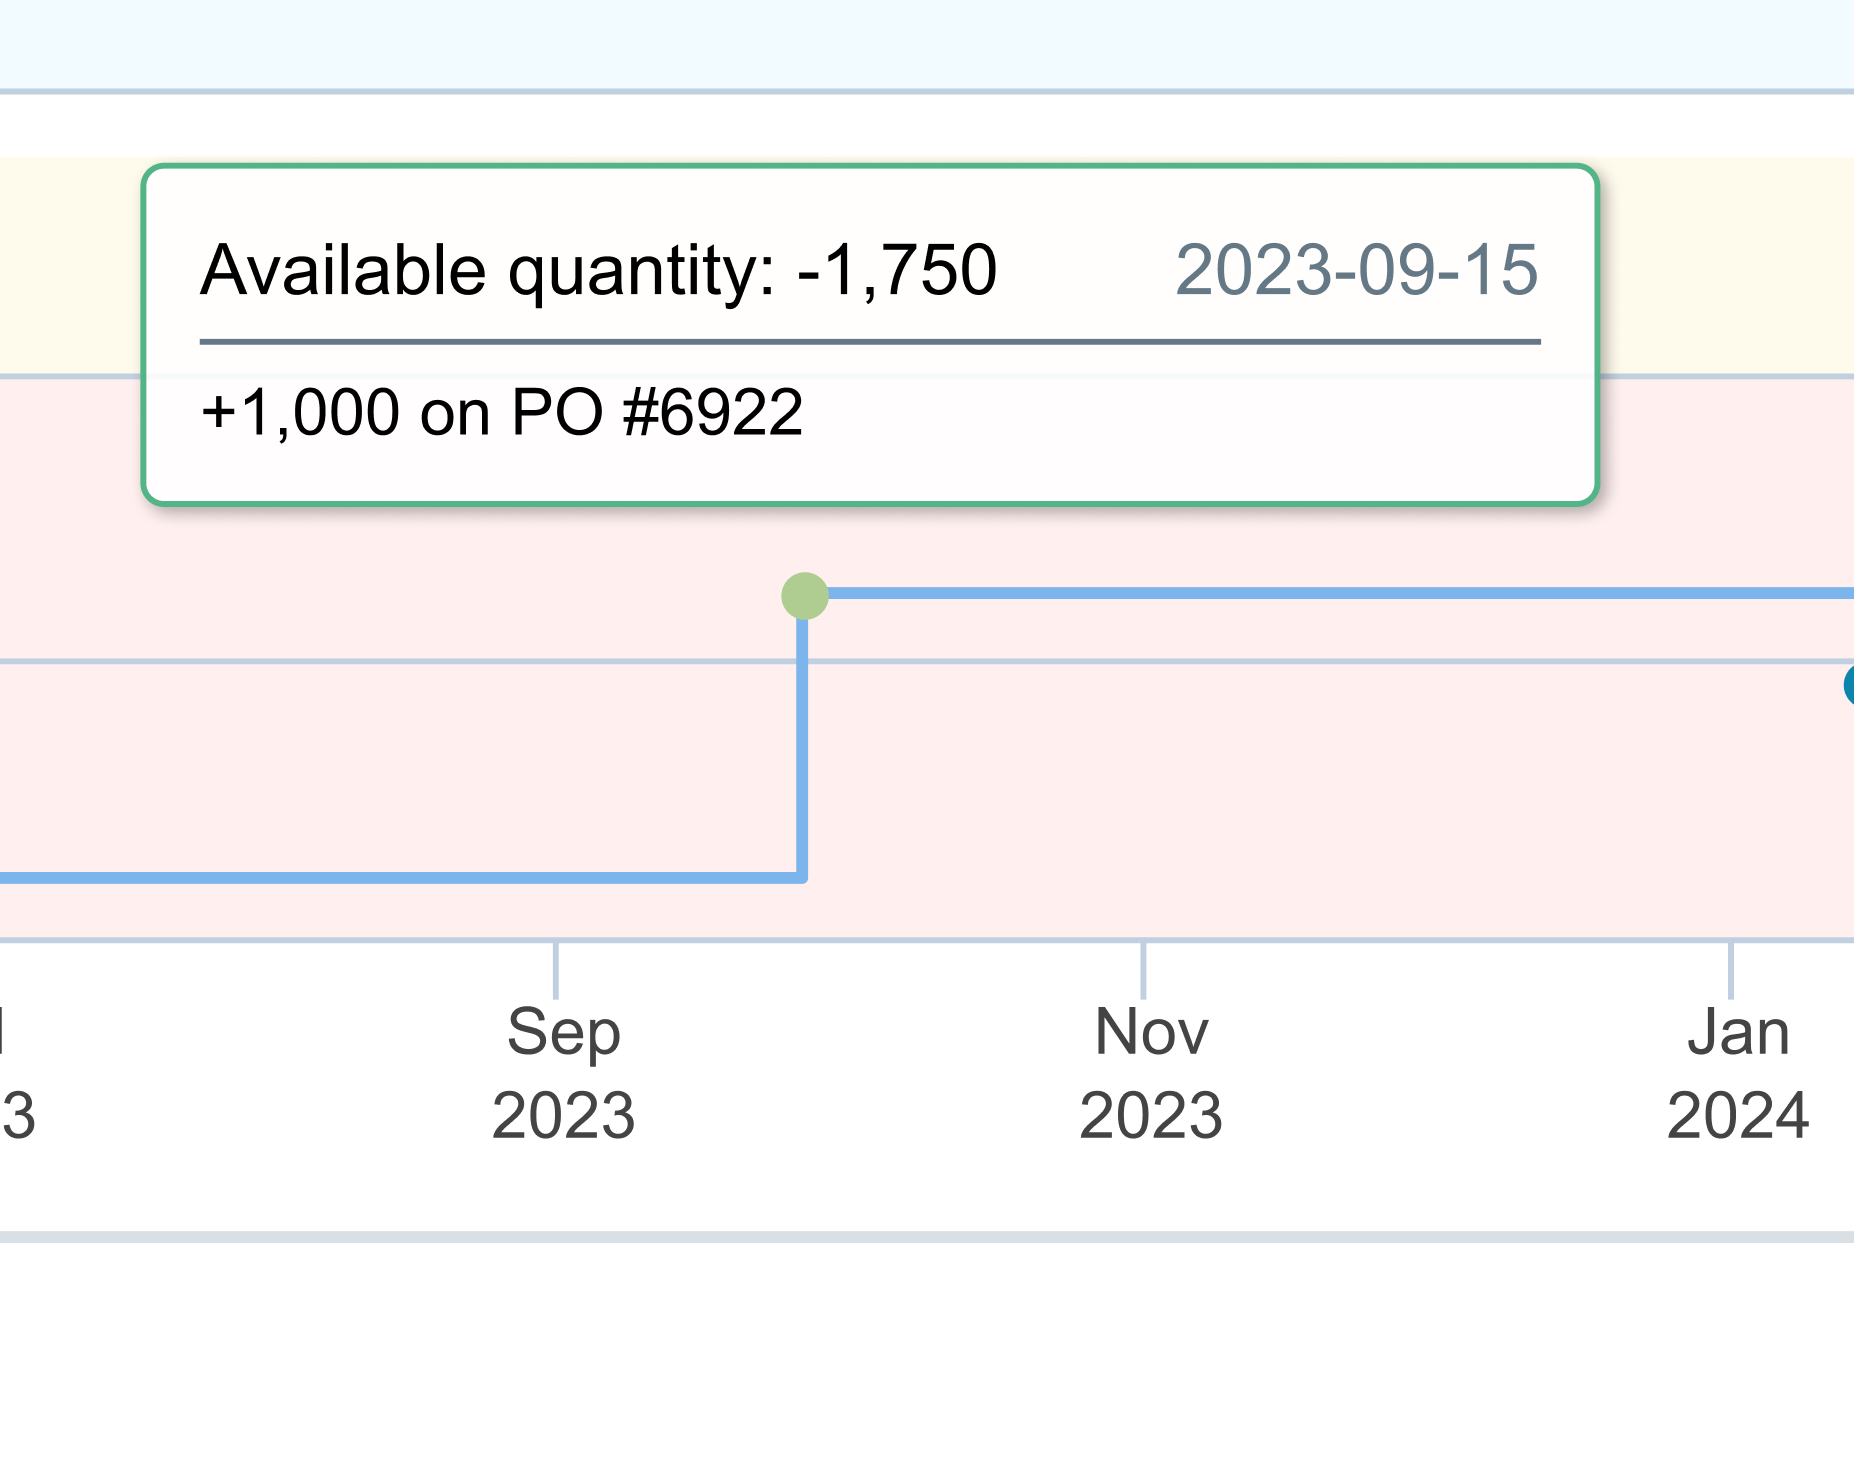
Purchase
Inventory replenishment is accomplished through Purchasing. The Incoming inventory on purchases is forecasted to arrive based on the item’s “Promise date” in the purchase. This establishes the expected date for material to arrive and be made available in inventory.
Demand Estimator
Demand is depicted on the inventory forecast chart as a decrease in inventory occurring on the date entered in the demand entry.