
The demand estimator feature is presently beta and subject to change without notice. This feature is provided free to all plans until 2024-07-01.
For additional information and to provide feedback, please contact [email protected].
The Demand Estimator is a tool where you can maintain customer- and channel-specific product demand information for forecasting and planning purposes. With the demand estimator, you and your team can::
- Create dated demand estimates for each relevant product and customer (or channel) pair.
- Include per-unit revenue for each demand entry for financial forecasting.
- Include demand on the inventory forecast chart to assist production planners in aligning their production schedule with forecast demand and safety stock requirements.
- Aggregate demand by product, customer, and time period for reporting.
- Aggregate component demand for buyer planning and vendor negotiation.
Navigation and Access
Permission to view and manage demand is granted in the Planning set of permissions. Contact your organization’s administrator for access.
Demand Entries
A demand entry is a single record that represents a quantity of demand for a specified product at a single point in time. This demand may represent an expected order from a specific customer or collection of sales from a channel over a period of time (e.g. 150 units of a product sold through Amazon in February 2022). The basic attributes of a demand entry are:
- Item / Part
- Customer / Channel
- Warehouse location – This is required to establish where the demand must be met.
- Quantity
- Date – This establishes the date when the demand is expected to be fulfilled. On the inventory forecast chart, the demand will be depicted as a decrease in quantity at this date.
- Revenue per Unit – This optional attribute allows Aligni to compute financial sales projections for finance teams. It is used to compute total revenue and gross profit over a period.
- Prominence – An integer setting between 0 and 100 that directs which demand entries are included in visualization and other depictions
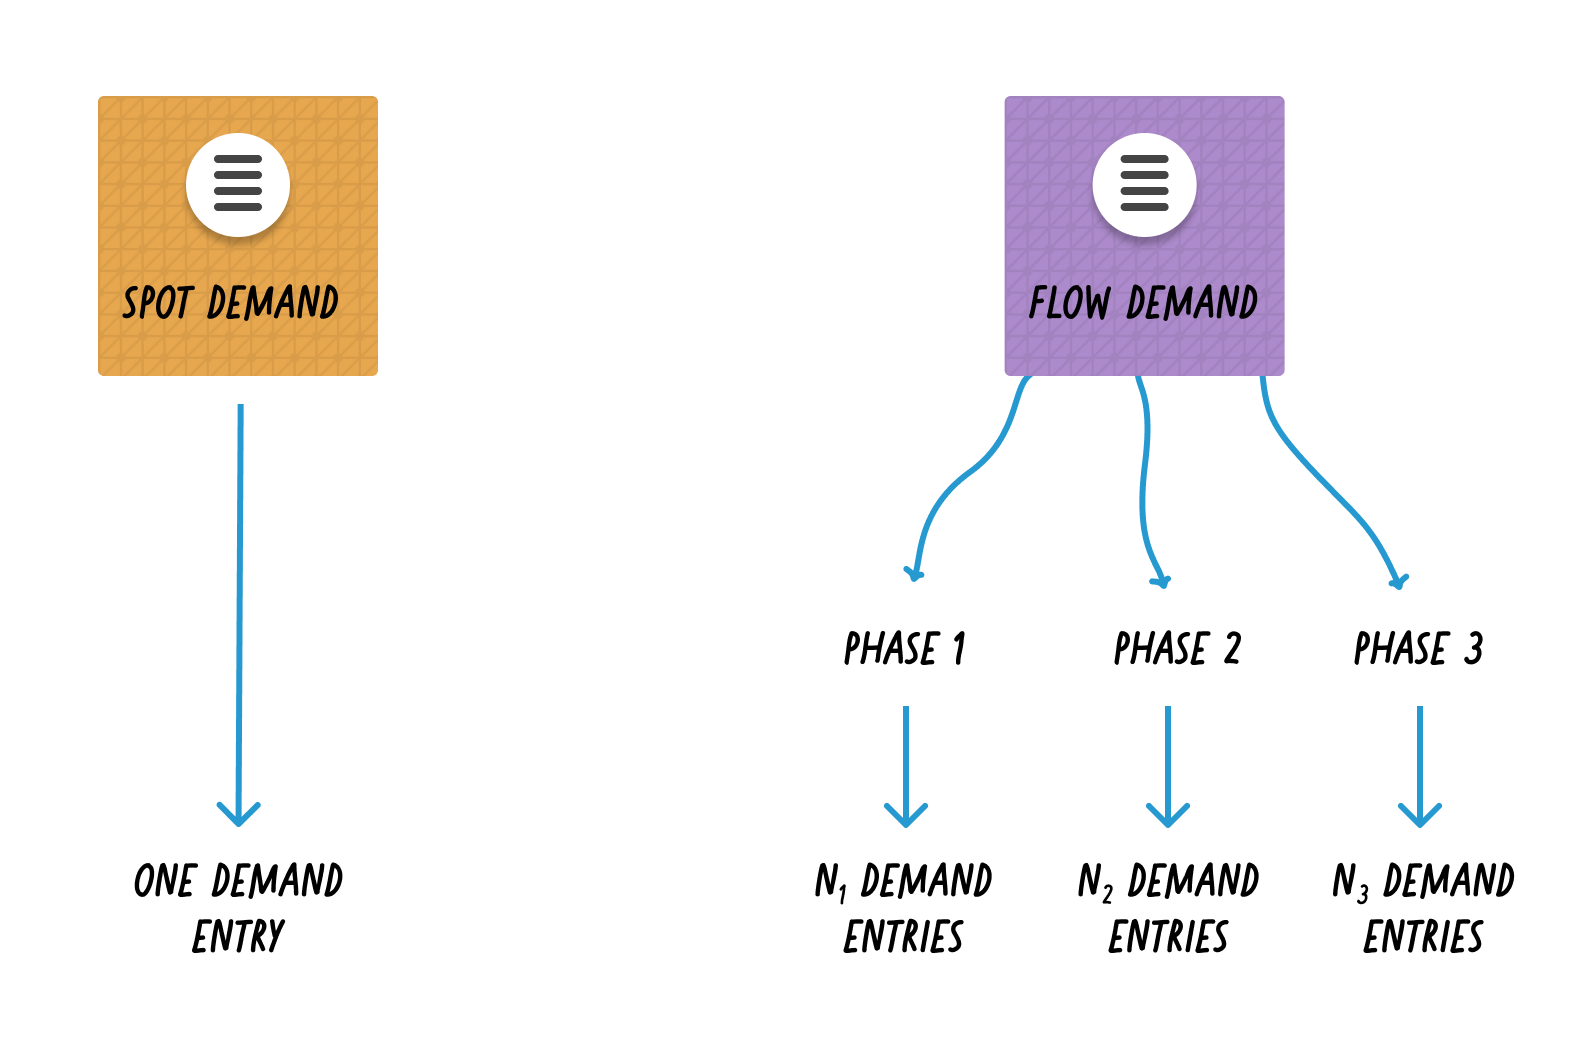
Spot Demand
Create a Spot Demand when a customer has shared information regarding a specific purchase that is not associated with a forecast of demand over time. As explained above the prominence qualifies the confidence of the demand.
Flow Demand
Create Flow Demand when a customer or channel is expected to have recurring demand at regular intervals. Flow demands generate multiple demand entries that are managed from a single, unified interface. Flows are defined by one or more phases and each phase may be characterized by growth or decline through the period
The relationship between spot demand, flow demand, and their corresponding demand entries is illustrated below. Demand entries are a limited resource. Spot demands will consume one demand entry each. Flow demands will consume one entry per each defined period across all of the phases.
Demand Visualization
Demand is depicted in a number of ways throughout Aligni. In addition to the Product Demand Matrix and Component Demand Matrix found in the Demand Estimator, demand is also found on the inventory forecast chart, individual item records, and customer records.
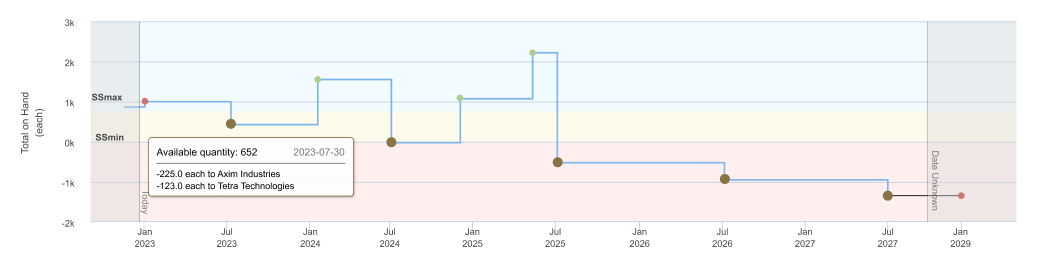
Inventory Forecast Chart
Demand is depicted on the inventory forecast chart as a decrease in inventory occurring on the date entered in the demand entry.
Product Demand Matrix
The Product Matrix tab displays a table of all demand organized by assembly. By default, each assembly’s demand is collapsed into a single table row, but may optionally be expanded to show individual customer demand for that assembly in a separate column.
Demand is organized by column using a selectable time period and sorted by part number or manufacturer part number.
You may optionally display the total revenue within each cell or corresponding the gross profit. Gross profit in this case is computed by subtracting the item’s standard cost from the revenue specified in the demand entry.

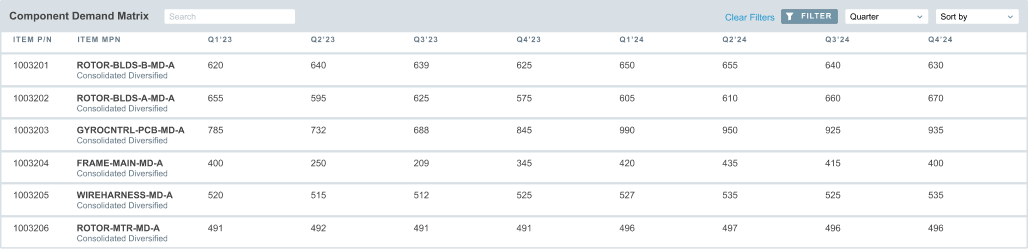
Component Demand Matrix
The Component Matrix tab displays a table of all components required by the corresponding products entered as demand entries. Each column represents a period of time and the contents of each item’s cell in the column is the quantity of that item that are demanded in that period.
You may optionally filter by manufacturer or part type to focus your attention on certain classifications of items. You may also search by part number or manufacturer part number.
Customer Demand Information
Customer-specific demand information may be found on the customer’s “Demand” tab.
Product Demand Information
Product-specific demand information may be found on the item’s “Demand” tab.